
Analysis and opinion · Streets
Parking complaints to the City doubled this year. Parking tickets didn’t.
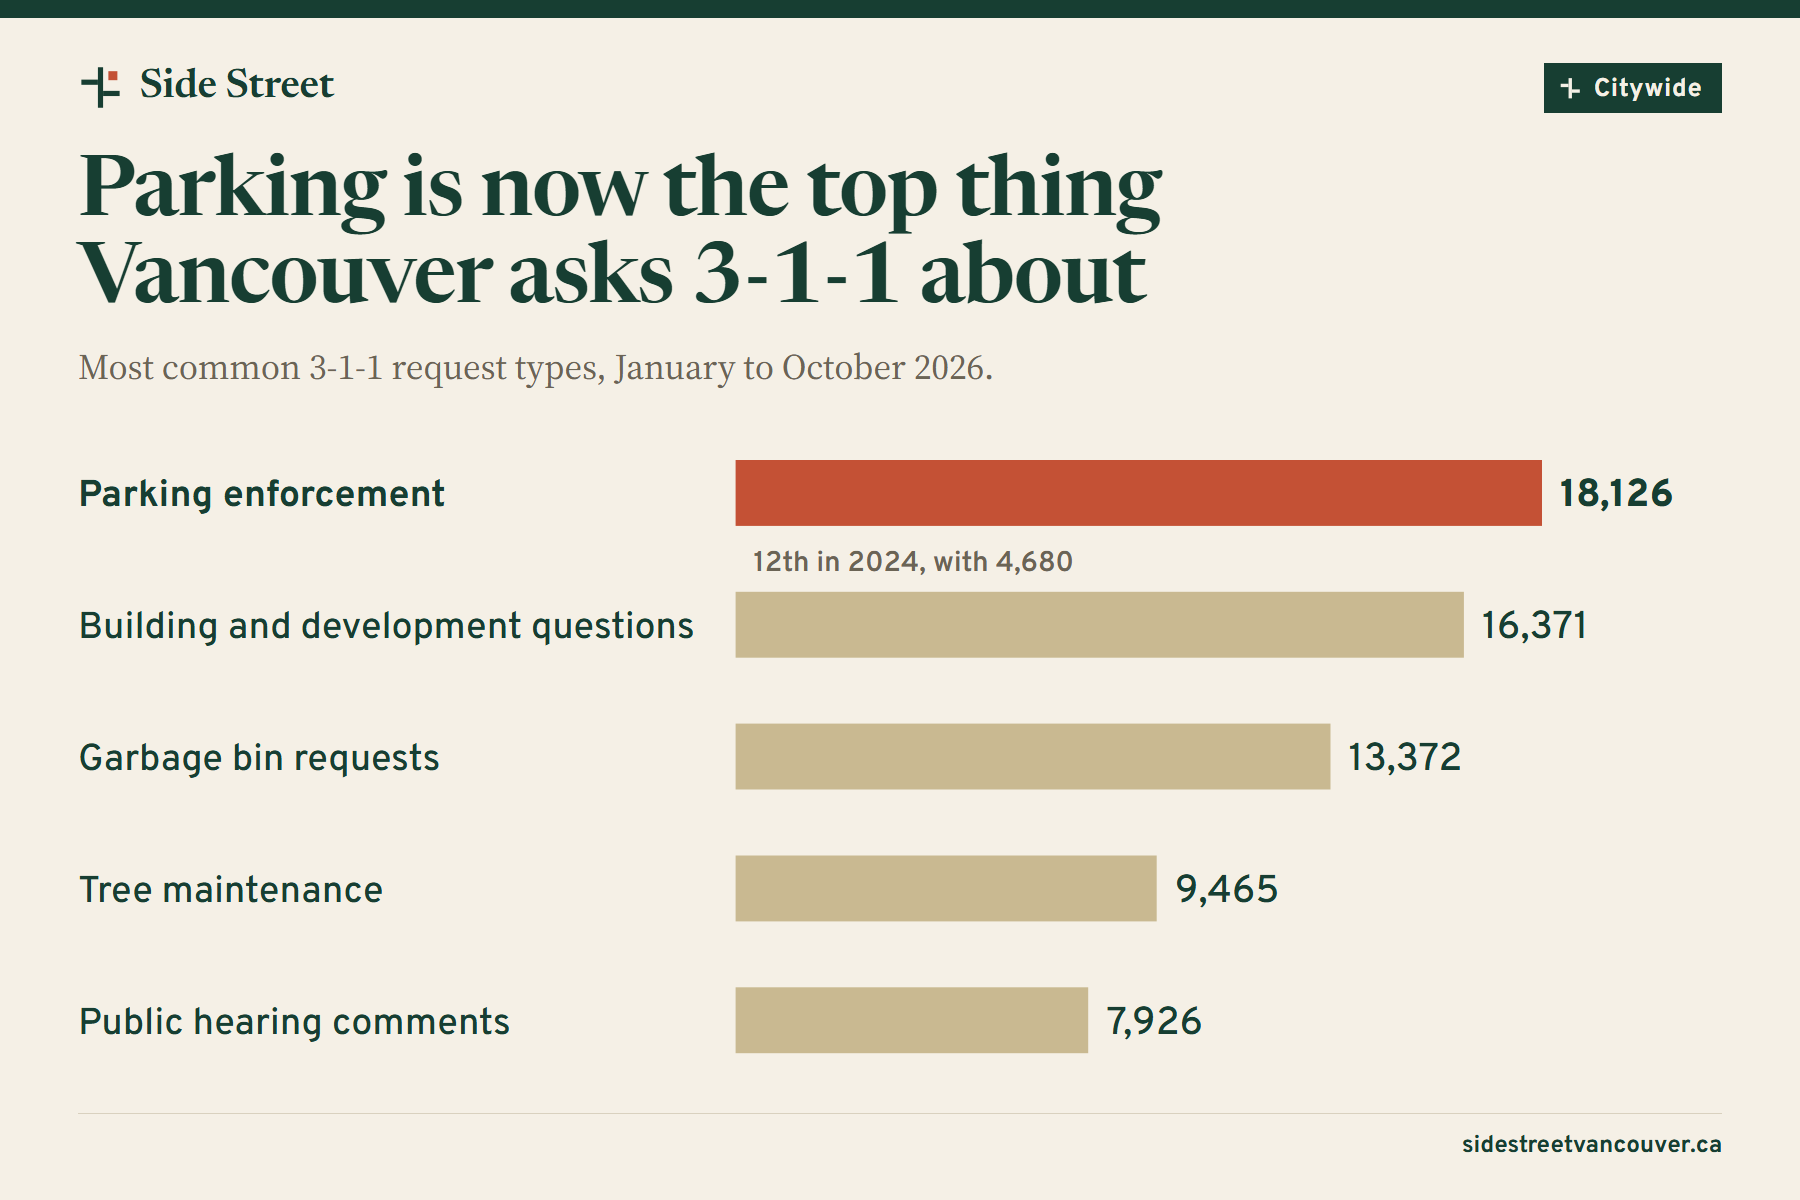
Parking is now the top reason Vancouverites contact 3-1-1: 18,126 requests from January to October, double last year. Tickets for blocking driveways stayed flat.
Share this article
Vancouver residents filed 18,126 parking enforcement requests with 3-1-1 from January to October. That is nearly double the 9,404 in the same months of 2025, and almost four times the 4,680 in 2024.
Parking is now the most common reason people contact 3-1-1, ahead of building questions and garbage bins. Two years ago it ranked 12th. Total 3-1-1 requests barely moved over the same months: 225,843 this year against 230,661 in 2025.
We counted every request in the City’s open 3-1-1 data and set them against the parking tickets the City also publishes. The two do not move together.
A steady climb
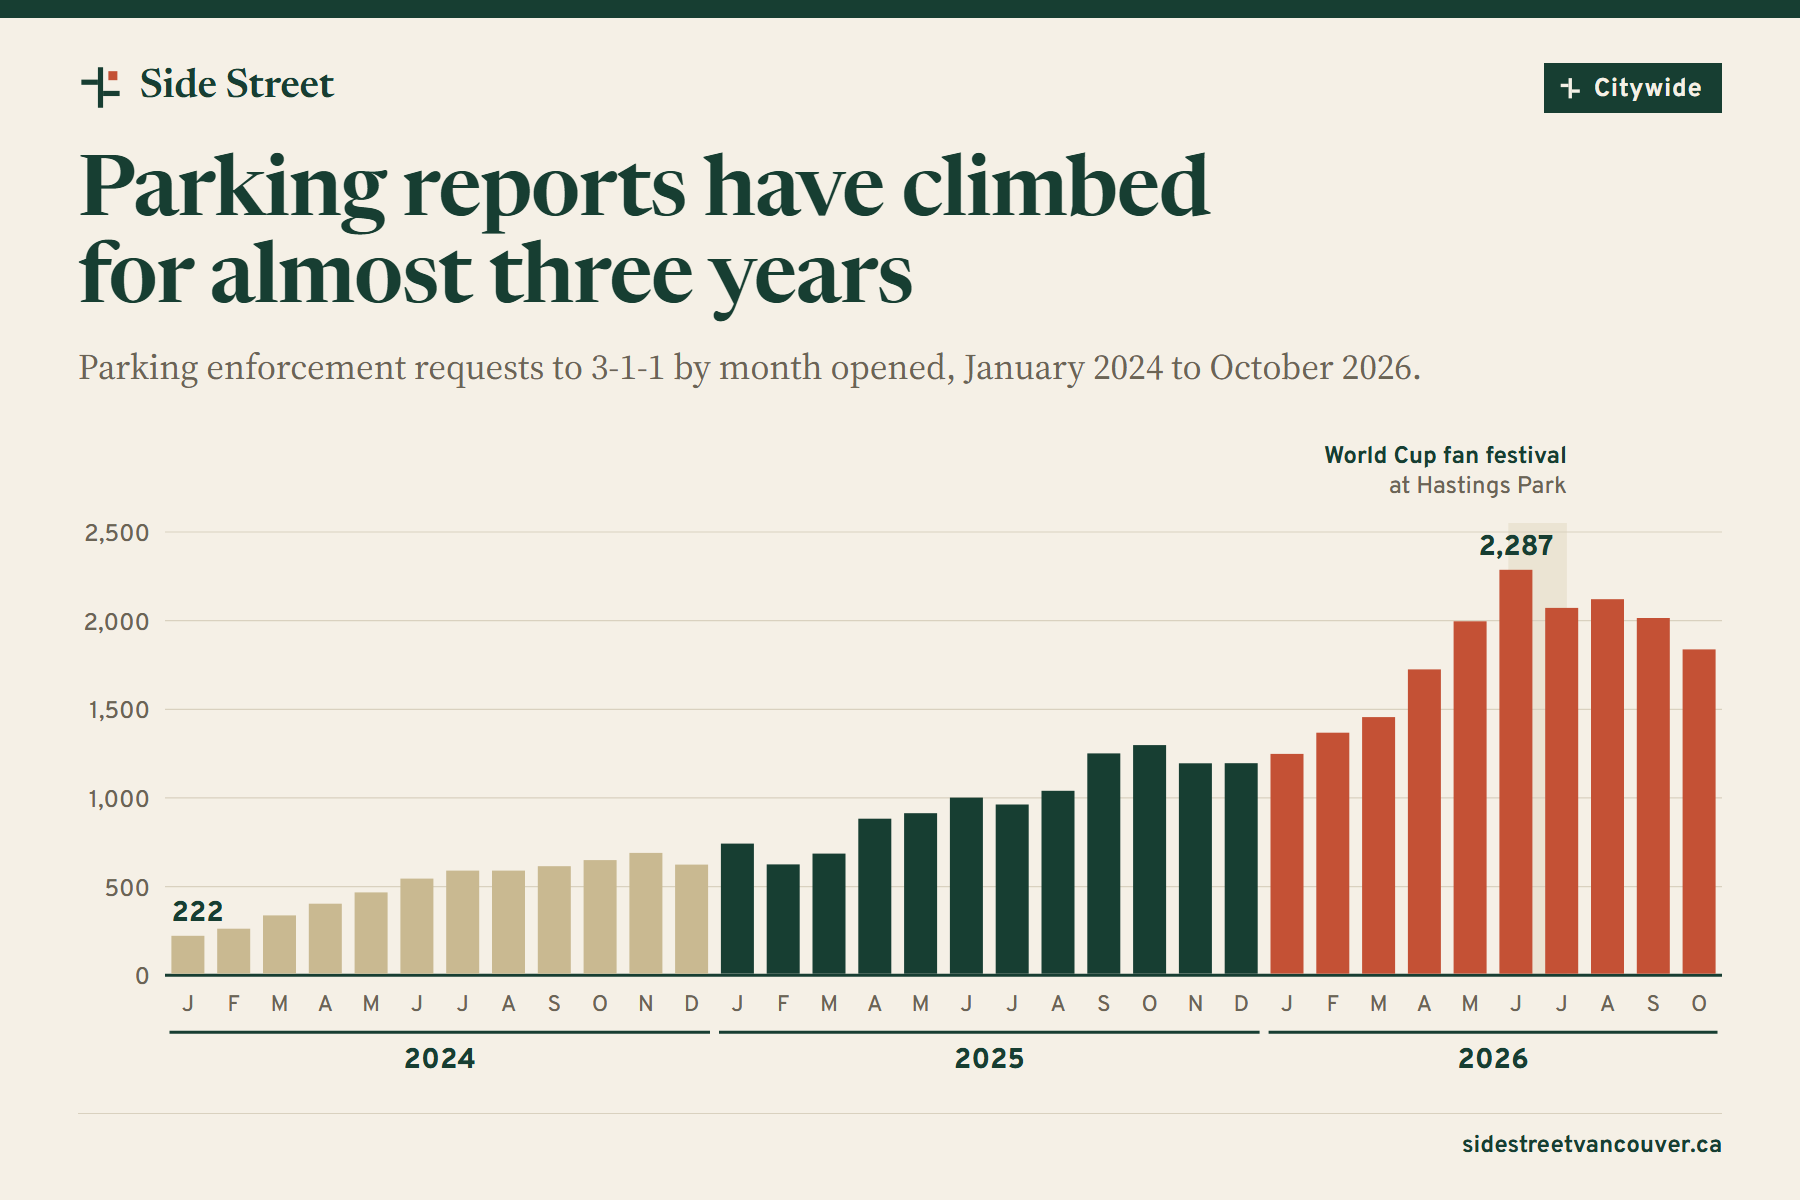
This is not a one-month spike. Parking requests have grown almost every month since early 2024, from 222 in January 2024 to 1,298 in October 2025 and a peak of 2,287 in June 2026. Every one arrived through the City’s app (12,890 this year) or its website (5,236). The same was true in 2024 and 2025: no parking request in the open data came by phone in any of the three years, so the rise is not a change in how calls are logged.
The World Cup explains part of the summer. Requests from Hastings-Sunrise jumped to 401 in June and 318 in July, while the FIFA Fan Festival ran at Hastings Park, against 62 and 59 a year earlier. Leave Hastings-Sunrise out and parking requests still rose 85%.
November shows the climb slowing but not reversing. From November 1 to 18, residents filed 966 parking requests, up 38% from 699 in the same days last year.
Twice the reports, about the same tickets
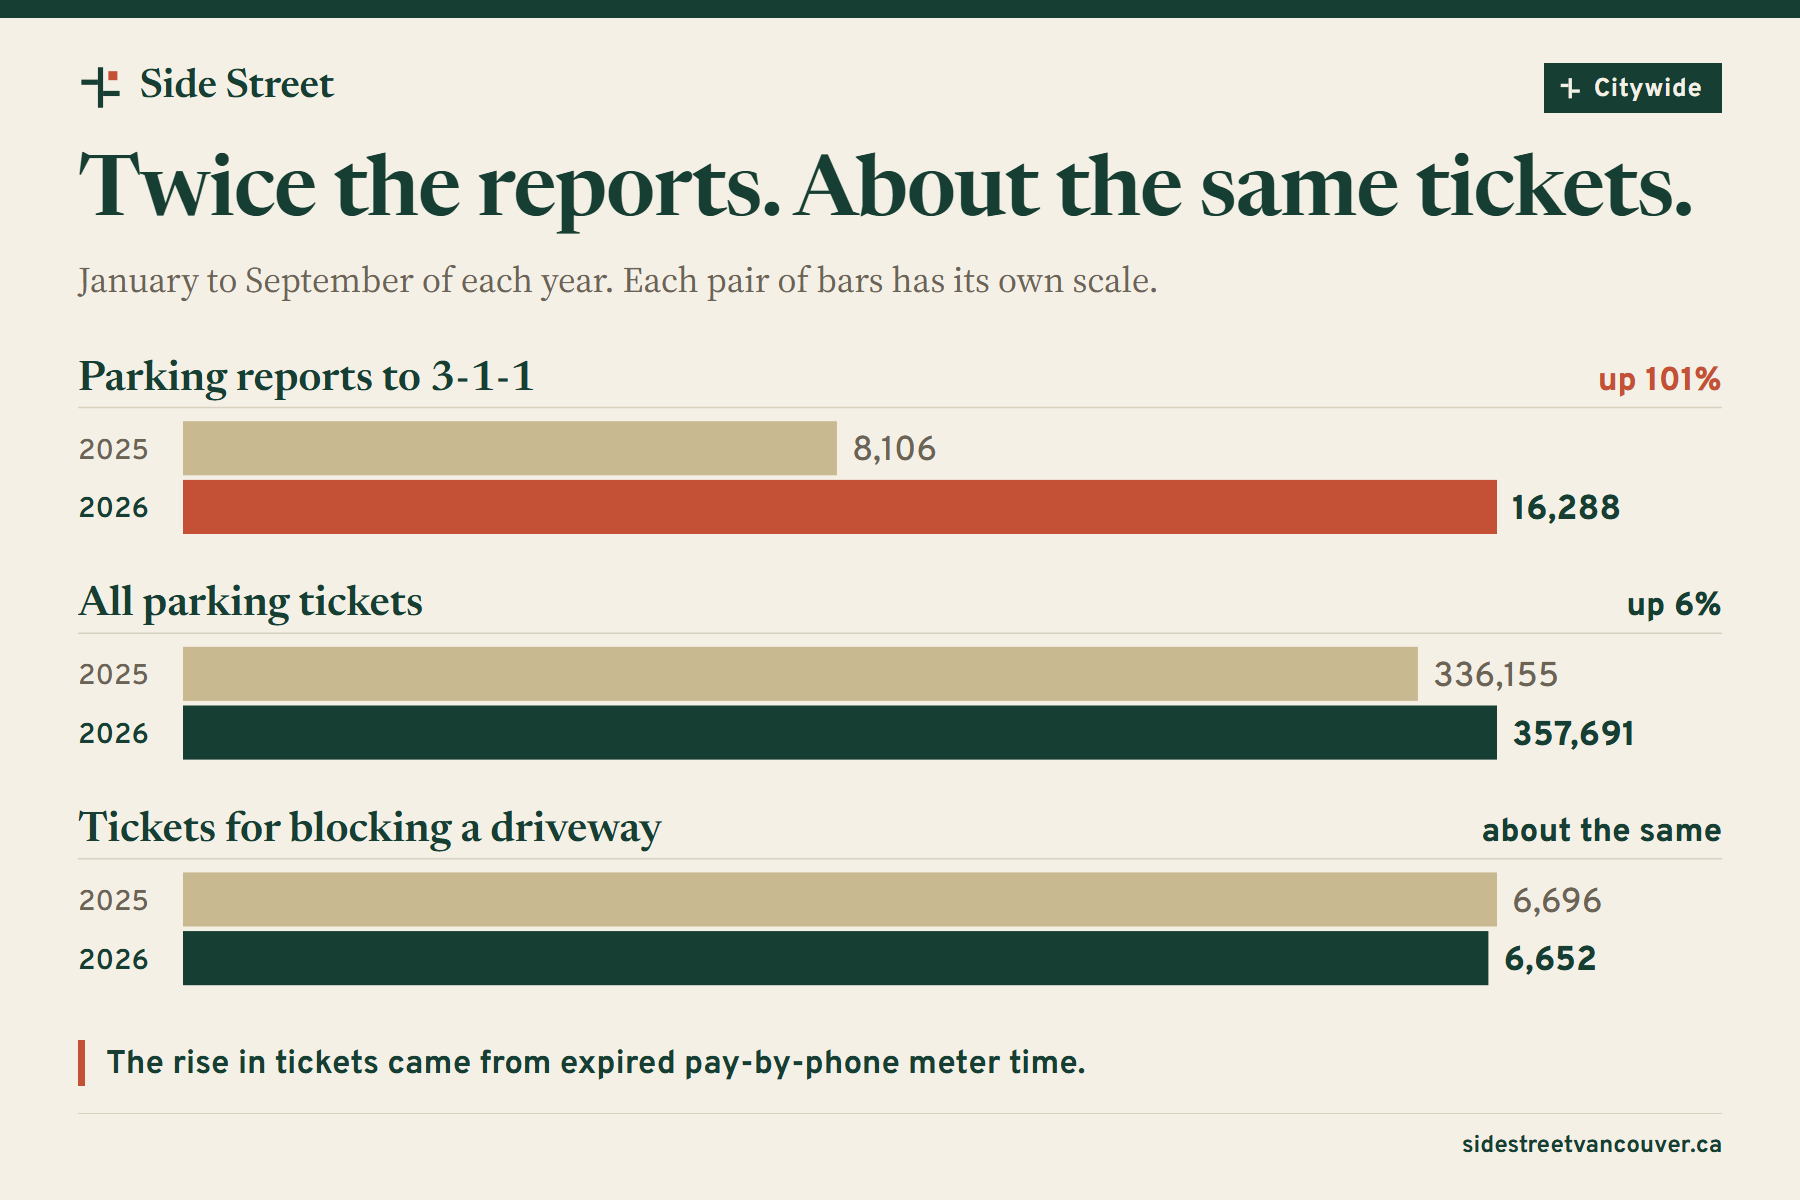
The City issued 357,691 parking tickets from January to September, up 6% from 336,155. Over the same nine months, 3-1-1 parking requests went from 8,106 to 16,288.
The extra tickets were for meters. Tickets for expired pay-by-phone or pay-by-plate time rose by 31,265, more than the whole increase. Leave those out and tickets fell 4%. Tickets for blocking a driveway or a lane crossing, the kind of problem a neighbour reports, held steady: 6,652 this year against 6,696.
A report is not a ticket. Some problems are reported more than once, and some cars have gone by the time an officer arrives. Still, the outcomes have shifted. The City closed 77% of this year’s parking requests as “service provided”, down from 84% in 2025. The share it referred elsewhere or closed with no action planned doubled, from 8% to 16%.
Where the reports come from
For their population, South Cambie and Riley Park file the most: 80 and 73 requests per 1,000 residents this year. Hastings-Sunrise is next at 52. South Cambie has grown since the 2021 census, so its rate is likely overstated. Arbutus Ridge (6), Dunbar-Southlands (7) and Downtown (9) file the fewest.
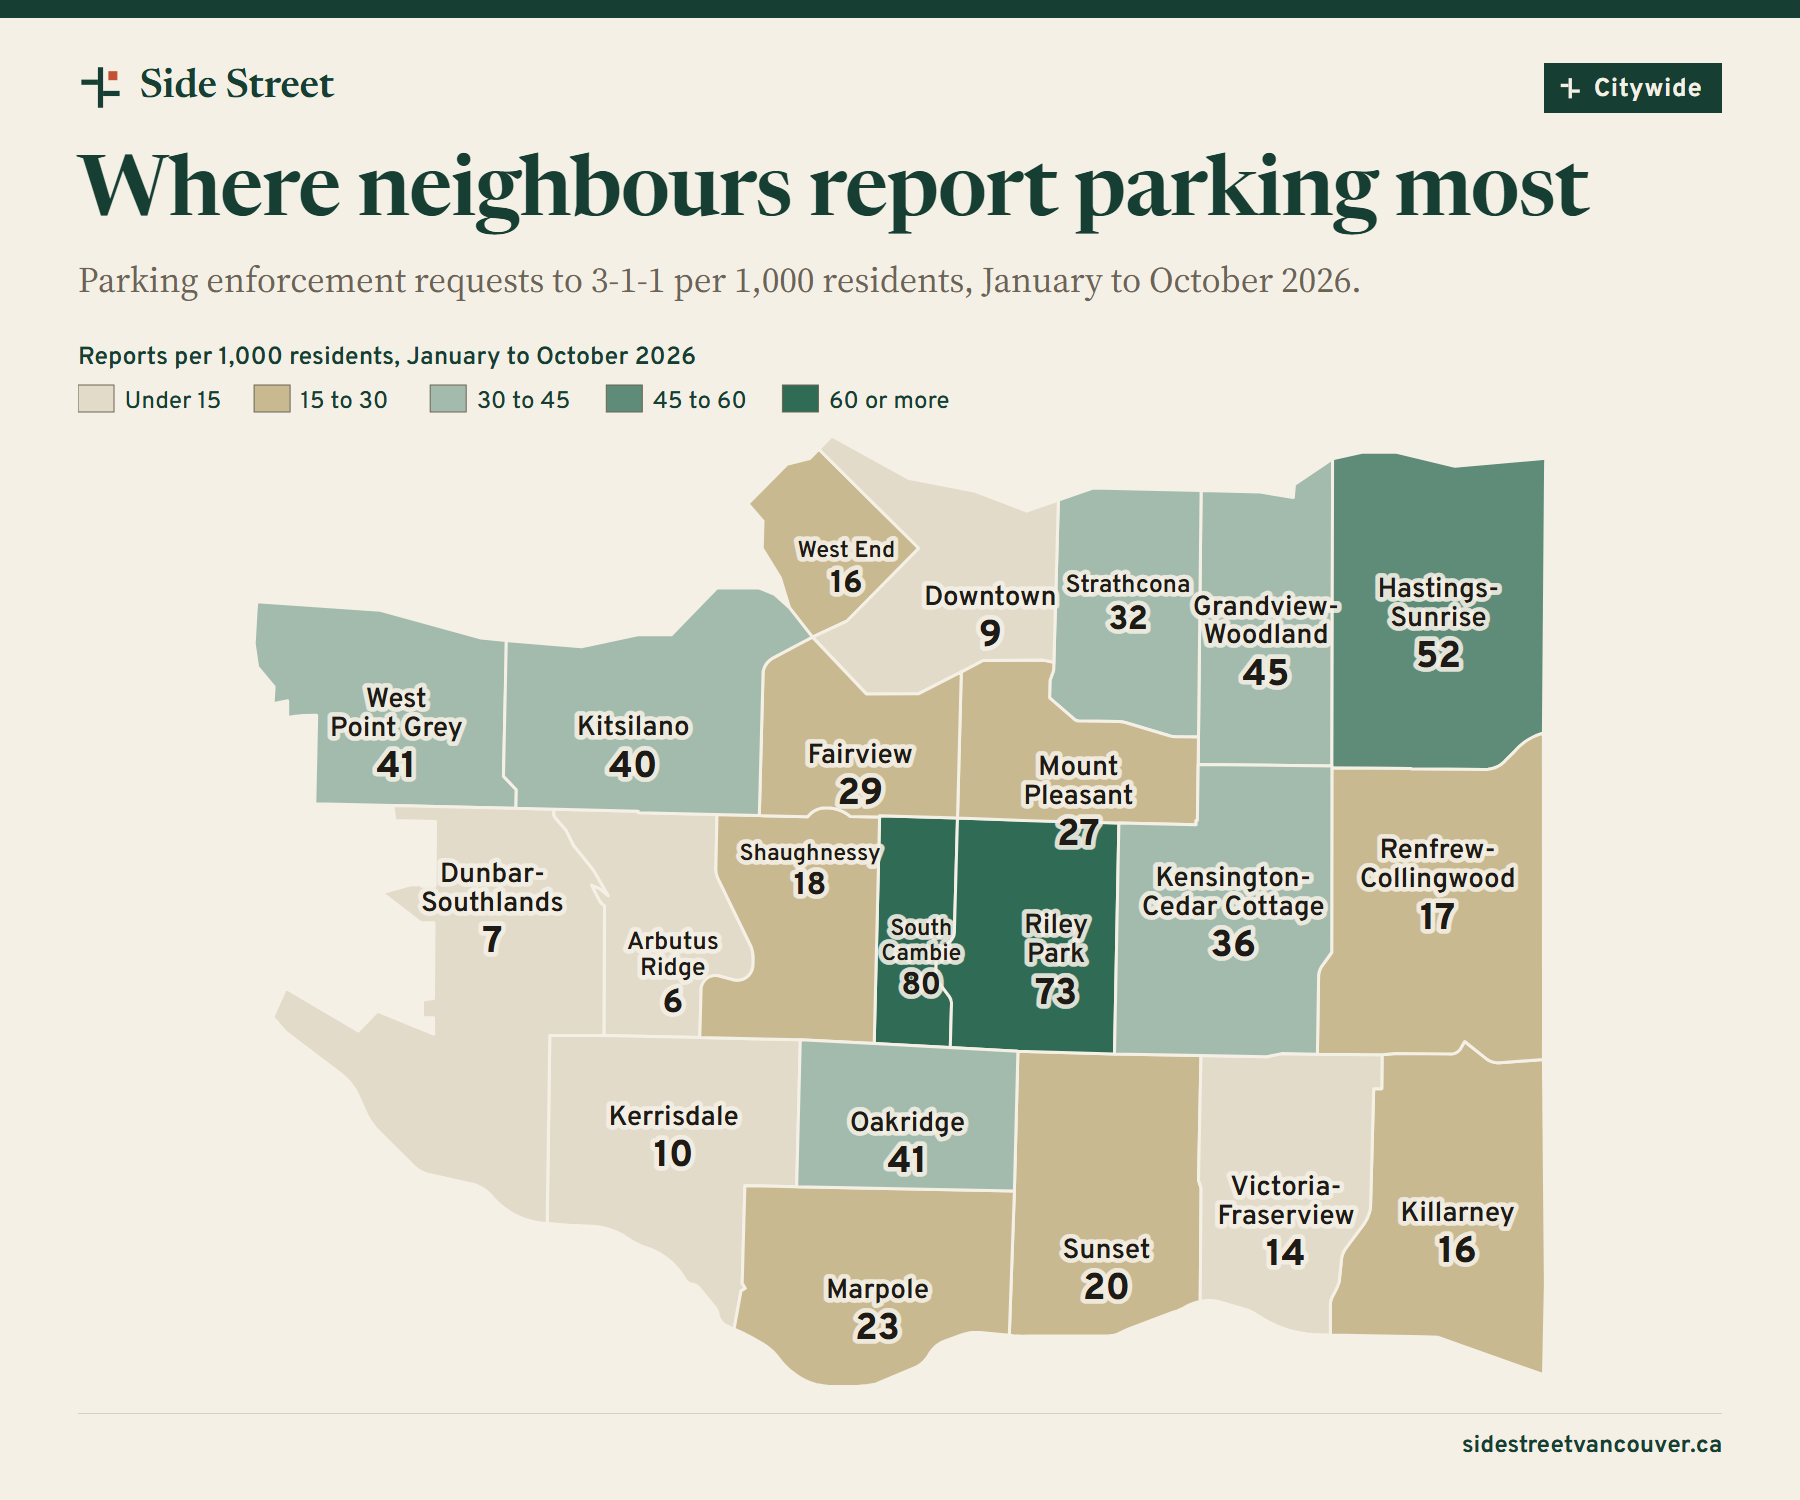
Oakridge was the only neighbourhood where requests fell, to 574 from 753. It is one of four areas where the City began mailing parking tickets in May, using licence-plate cameras, in a pilot aimed at zones where staff had “observed low compliance”. Oakridge’s requests were already down before the pilot began, so we can’t credit it. In Grandview-Woodland, which takes in the Commercial Drive pilot area, requests nearly doubled.
| Neighbourhood | 2025 | 2026 | Per 1,000 residents, 2026 |
|---|---|---|---|
| South Cambie | 356 | 786 | 80 |
| Riley Park | 917 | 1,743 | 73 |
| Hastings-Sunrise | 599 | 1,840 | 52 |
| Grandview-Woodland | 641 | 1,273 | 45 |
| Oakridge | 753 | 574 | 41 |
| West Point Grey | 178 | 539 | 41 |
| Kitsilano | 869 | 1,799 | 40 |
| Kensington-Cedar Cottage | 1,139 | 1,824 | 36 |
| Strathcona | 184 | 440 | 32 |
| Fairview | 494 | 986 | 29 |
| Mount Pleasant | 612 | 1,004 | 27 |
| Marpole | 261 | 622 | 23 |
| Sunset | 365 | 743 | 20 |
| Shaughnessy | 95 | 152 | 18 |
| Renfrew-Collingwood | 496 | 890 | 17 |
| West End | 425 | 785 | 16 |
| Killarney | 215 | 509 | 16 |
| Victoria-Fraserview | 291 | 435 | 14 |
| Kerrisdale | 48 | 143 | 10 |
| Downtown | 305 | 652 | 9 |
| Dunbar-Southlands | 44 | 150 | 7 |
| Arbutus Ridge | 52 | 98 | 6 |
We are asking the City why parking requests have doubled and what its mailed-ticket pilot has found, and will add its answers here.
What we think
On most residential streets in Vancouver, parking is free and unlimited, so the curb fills up and the disputes go to 3-1-1. Twice the complaints has not brought twice the response. Enforcement that waits for complaints leaves neighbours policing each other through an app, while tickets for blocked driveways stay flat.
There is a better tool, and the new mayor has voted for it. In October 2021, staff proposed an overnight permit for every residential street, about $45 a year, or $5 for low-income residents. Council rejected it 6-5. Pete Fry was one of the five in favour. He is now mayor, and the three new councillors who answered our questionnaire, Bridget Burns, Devyani Singh and Solomon Yi-Kieran, all agreed the City should rebuild streets for safety even where that removes parking.
A modest permit, brought in block by block where residents ask for it, would manage the curb before it becomes a complaint. Until then, the City should publish what its mailed-ticket pilot found and report each year how many parking requests lead to a visit or a ticket. Twice the complaints and the same tickets is not working for anyone, including drivers.
How we counted: 3-1-1 requests of the type “Parking Enforcement Request Case”, by the date each was opened, from the City’s open data downloaded November 11, 2026; November counts checked November 20. Tickets are from the City’s parking-ticket datasets. Driveway tickets combine the two bylaw sections for stopping in front of a driveway or private road and in front of a lane driveway.
Vancouver election guide · Try the Vancouver election compass · Standards and corrections
